Wastewater treatment capacity (WWTP)
Shows WWTP footprints, capacities, and service footprints so you can align digestion partners with municipal operators.

Planning layers for wastewater, food waste, disposal, and invasive harvests. Use them to match feedstocks with hosts and routes.
Each map pairs a story about density, infrastructure, or invasive harvests with the governance context that matters for pilots and procurement. Scroll to each section for full-size views and field notes.
Shows WWTP footprints, capacities, and service footprints so you can align digestion partners with municipal operators.
Highlights institutional, retail, and wholesale generators that exceed typical diversion thresholds for capturing nutrients.
Tracks disposal corridors, closed landfills, and transfer stations to inform diversion plans and permit constraints.
Focuses on invasive aquatic biomass locations that could supply anaerobic digestion pilots while pairing removal logistics with sensitive habitats.

Shows municipal WWTP footprints, capacities, and service areas that help align digestion partners with operators.
Use it for
Limit: Municipal reporting can lag; verify volumes with operators before locking contracts.
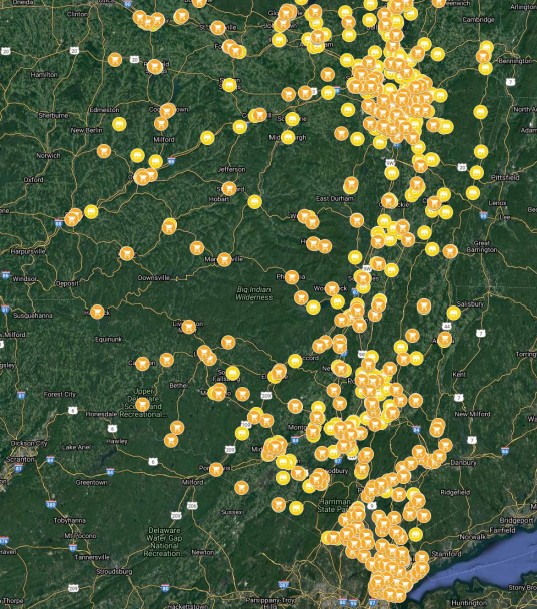
Highlights generators that exceed diversion thresholds for anaerobic digestion and composting pilots.
Use it for
Limit: Thresholds are estimates; confirm quantities and seasonality before committing.
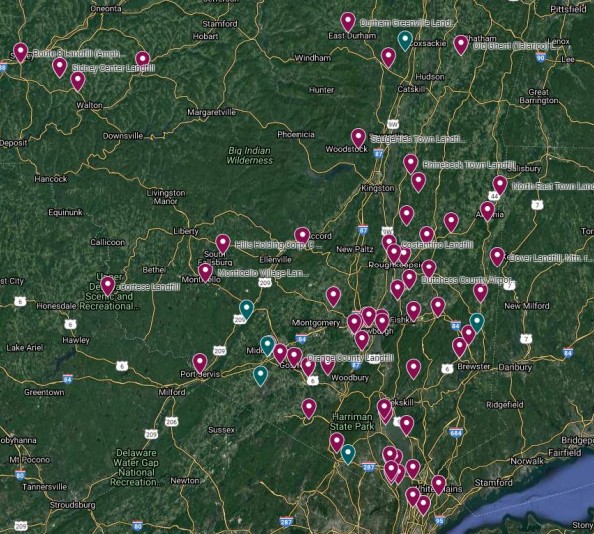
Tracks disposal capacity, regional hauling, and permit boundaries to reveal diversion challenges.
Use it for
Limit: Permits shift quickly; verify scopes with DEC and waste authorities before citing.
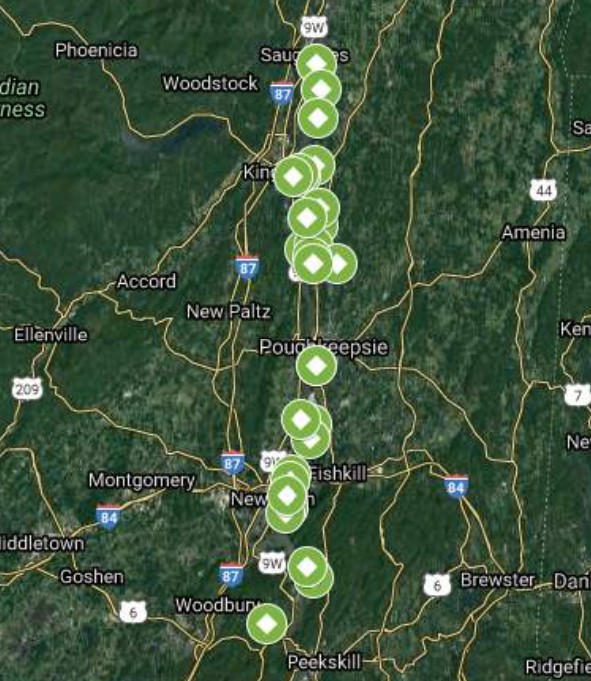
Pairs invasive control data with potential collection points for anaerobic digestion pilots.
Use it for
Limit: Populations shift yearly; reconfirm with DEC invasive species teams before scaling.
Have a site candidate? Start the intake so HVB can help package the pilot.