
Feedstocks assessment
A county-by-county map of Hudson Valley organics flows, tonnages, and reuse levers. Use it to align municipal sponsors, waste haulers, and project teams around how much material exists, where it can go, and how a pilot bridges the gap.
We lead with outcomes and constraints (not equipment marketing): siting, permitting, feedstock contracts, community trust, and the funding path to build.
Organics flows mapped for pilots
This PDF aggregates municipal waste tallies, wastewater solids, and food hub collections so you can speak confidently about the volumes anyone can touch — surfacing the tonnages and routes that belong in a grant-ready bundle.
Each graphic, table, and note is built for municipal sponsors, feeding partners, and pilot engineers who need credible data fast. The carry-forward language keeps your coalition consistent with HVB’s flow modeling.
What the assessment covers
Five organics streams across ten Hudson Valley counties, mapped to reuse pathways. The one stream we can size precisely today — landfilled biosolids — alone runs to 7,348 tons a year.
Organics streams
Reuse pathways
Feedstocks assessment
Regional resource potential and system context for organics-to-value solutions.
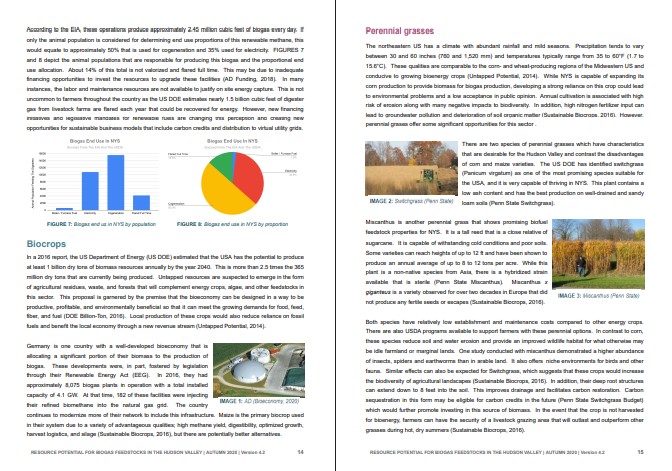
This two-page spread is the proof artifact from the home page card; it surfaces the county-by-county map, tonnage matrix, and reuse levers that drive the report narrative.
Keep it handy when introducing the report in proposals, stakeholder meetings, or grant write-ups so everyone can see the flows you are describing.
Explore the data behind the report
Download the full report
Ready to use this data? Book a fit call and we'll match your pilot idea to the right partners and grant-ready assets.