Map the region
Layer every feedstock source atop the infrastructure that could move and process it.

This page records the filters, layers, and partnership logic behind every HVB proposal so that circuits stay accountable, inclusive, and ready for real-world deployment.
Every HVB proposal runs the same gauntlet: map the region’s feedstocks and infrastructure, apply coverage rules that keep the network balanced, score each candidate across four dimensions, and shortlist only what is ready to defend. This page shows that method — and how all ten proposals scored.
Four stages take a region-wide picture down to a defensible shortlist.
Layer every feedstock source atop the infrastructure that could move and process it.
Space proposals 25–50 miles apart, cap two per county, span NYC to the Capital Region.
Rate each candidate on four dimensions — ready, watch, or neutral.
Keep the strongest, best-distributed candidates and document the reasoning.
We overlay where organic material comes from with the infrastructure that can move and convert it. The layered atlas lets us toggle those layers and test whether the paper map matches the ground.
Where the organics are.
What can move and process them.
Coverage stretches from New York City to the Capital Region to connect the densest demand corridors — governed by three rules.
Dense enough for shared logistics, while respecting the 25-mile radius the Excess Food Waste Law assumes for collection partners.
Spreads investment, prevents any county from being overtaxed, and keeps operational support feasible.
Anchors the Hudson Valley story to the region’s densest demand and its regulatory context.
Every candidate is scored on the four dimensions below. The matrices summarize subjective judgment, so we explain each rating on the proposal’s own page — open any row to read the reasoning.
Access to trucks, rail, or barges, plus co-located industrial partners and an existing logistics footprint.
Volume, seasonality, contaminants, and how many feedstock types (ag, biosolids, invasive, municipal) sit in one radius.
Thermal backbone, biochar demand, and synergy between thermal conversion and AD digestate.
Available acreage and synergies with composting, storage, digestate polishing, or ag extensions.
| Proposal | Industrial & hauling |
Feedstock variation |
Pyrolysis potential |
Space & expansion |
|---|---|---|---|---|
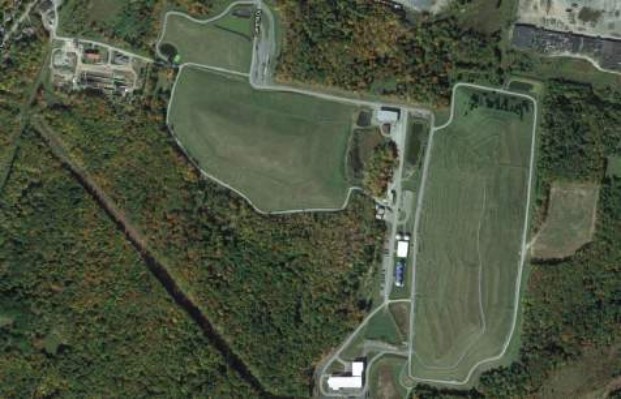
| Monticello Transfer StationSullivan County | Ready | — | Watch | Ready |
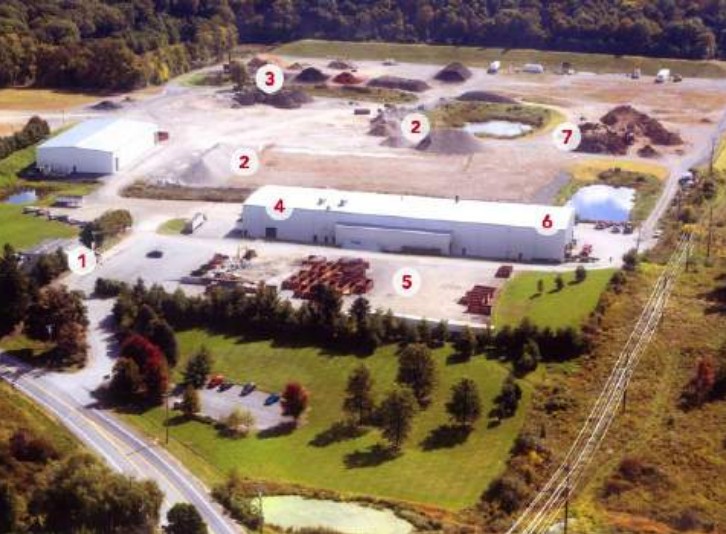
| Taylor-MontgomeryOrange County | Ready | Ready | Ready | Watch |
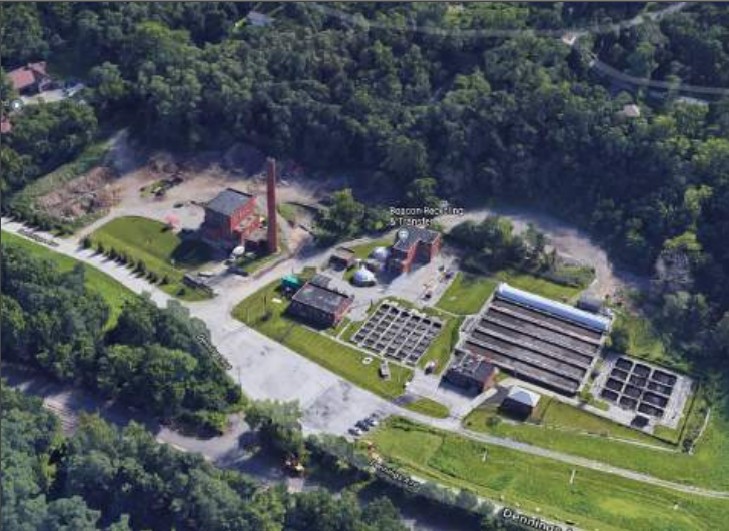
| Beacon Recycling & TransferDutchess County | Ready | — | Watch | Watch |
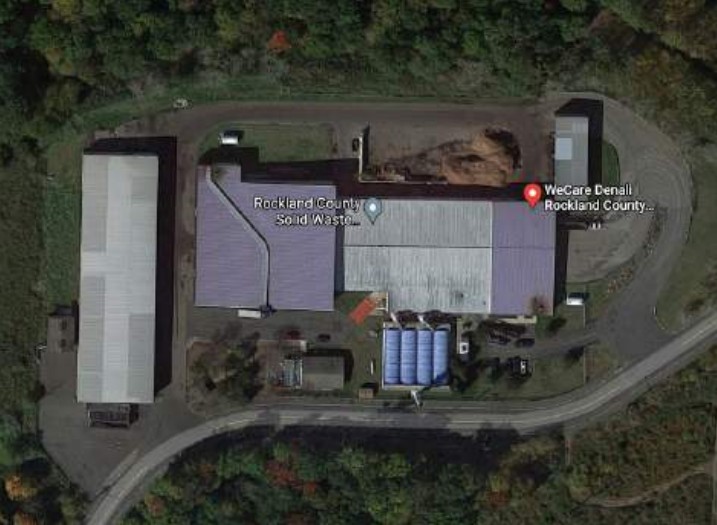
| WeCare Denali RocklandRockland County | Ready | — | Ready | Ready |
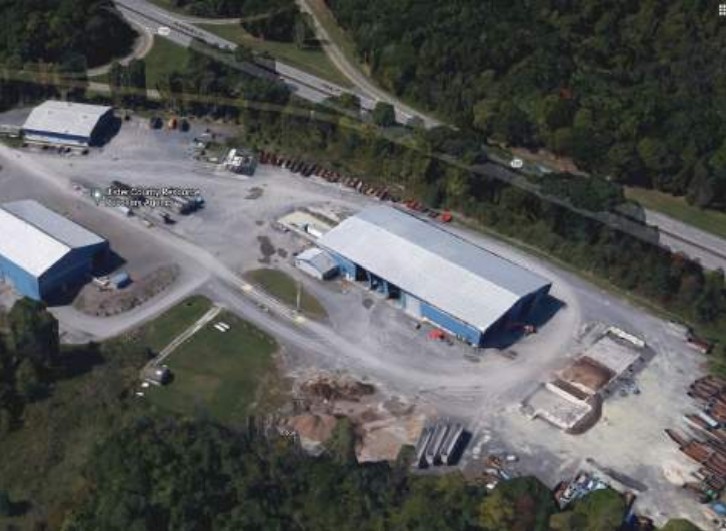
| Ulster County RRAUlster County | Ready | Watch | — | Ready |
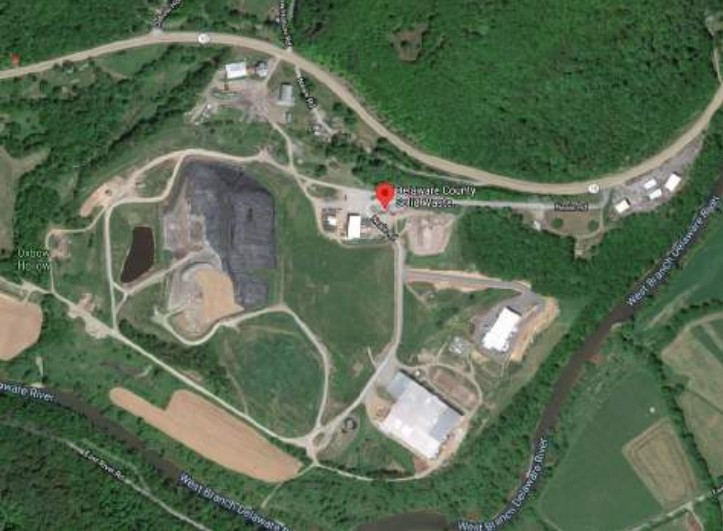
| Delaware County SWMCDelaware County | Watch | — | — | Ready |
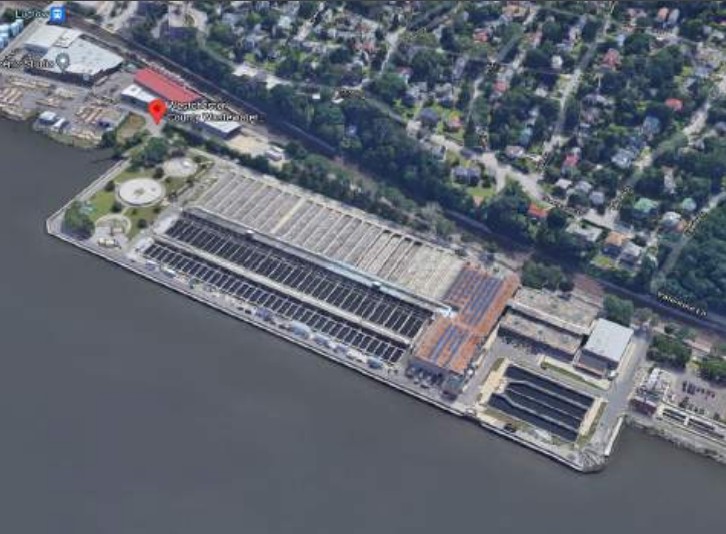
| Westchester County WWTPWestchester County | Ready | Watch | — | Watch |
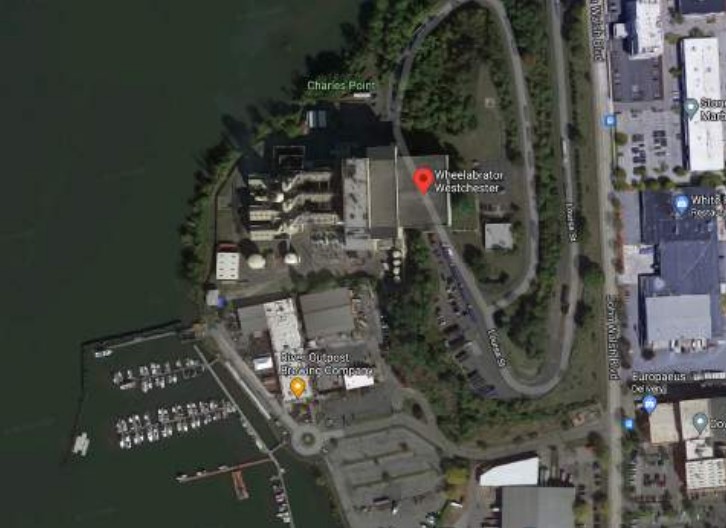
| Wheelabrator WestchesterWestchester County | Ready | — | Ready | — |
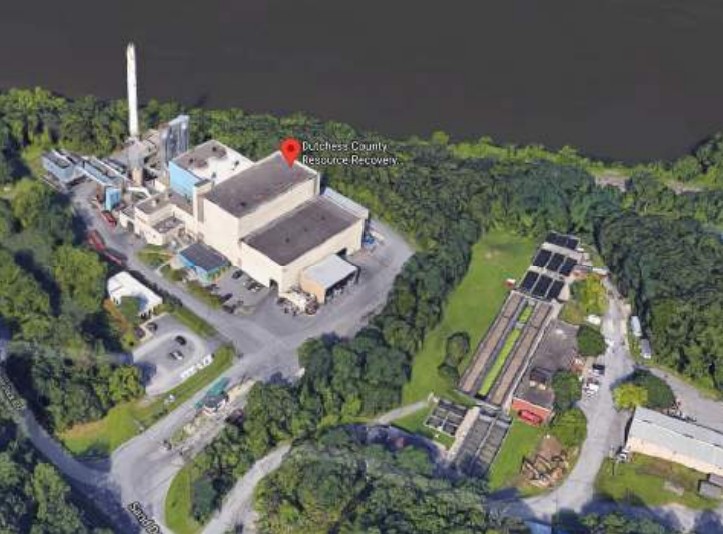
| Dutchess County R&RDutchess County | Ready | — | — | Ready |
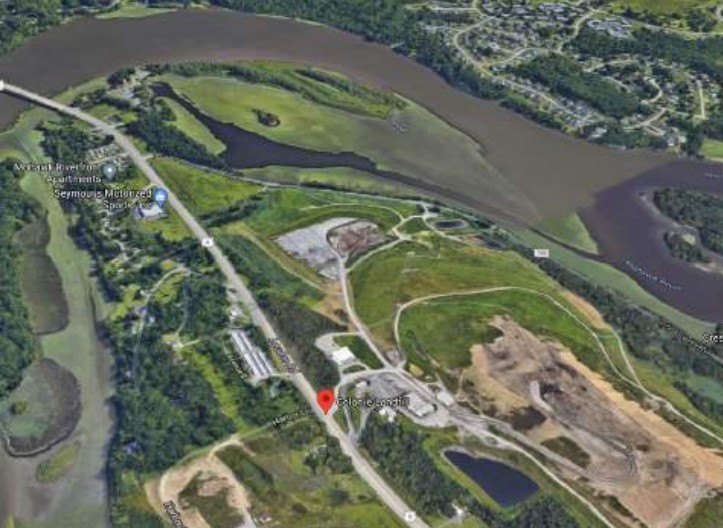
| Colonie Solid Waste LandfillCapital Region | Ready | — | Ready | Ready |
Reading the matrix: hauling is nearly universal — 9 of 10 sites are ready — so it rarely decides a shortlist. Feedstock variety is the scarcest strength: Taylor-Montgomery is the only site that pairs several streams (agricultural, biosolids, and invasive biomass) in one radius. Pyrolysis readiness and room to expand both cluster at the landfill- and campus-scale sites, with Colonie, WeCare Denali, and Wheelabrator leading on both.
EJ regions are plotted near every proposal so planners can see exposures, burdens, and opportunity areas — supporting inclusive outreach and a seat at the table for the communities most affected by today’s waste system. Screening follows New York’s CP-29 thresholds.
≥40% minority population and ≥23% poverty flags a community for EJ screening.
≥10% minority population and ≥25% poverty flags a rural community for screening.
Odor and traffic plans up front, public monitoring commitments, and clear boundaries on excluded streams.
We tailor capacity-building materials, governance touchpoints, and engagement cadences so each audience gets what it needs without redundant meetings.
Strategic alignment, funding, and region-wide coordination.
Day-to-day operations, contamination control, and equipment.
Ten circular-biogas proposals, distributed across the valley. Open any one for its site-selection rationale, partner lanes, and diagrams.