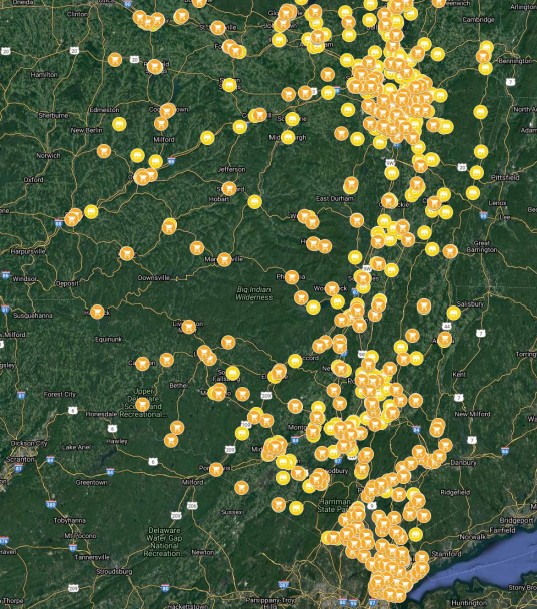
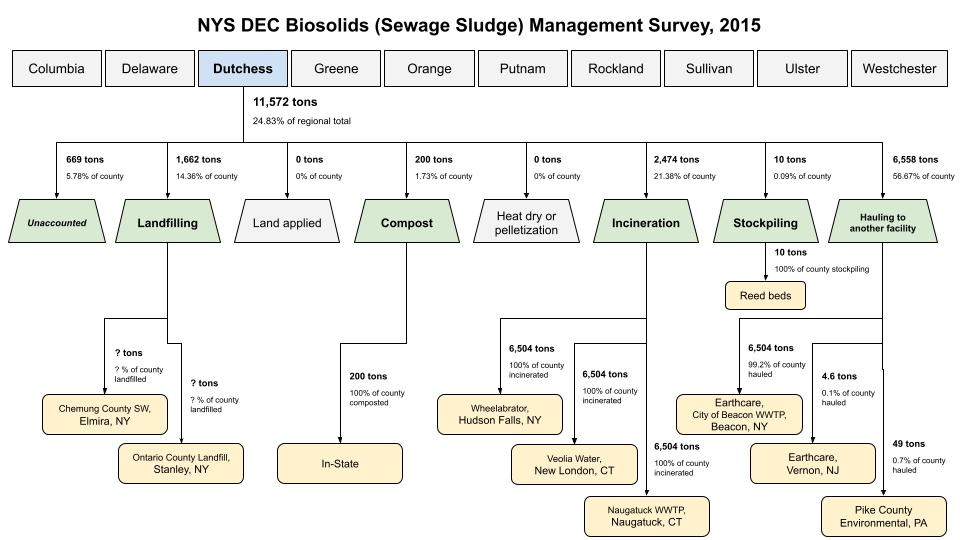
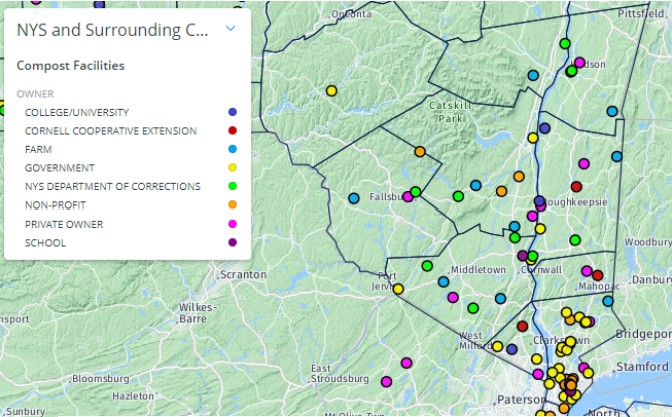
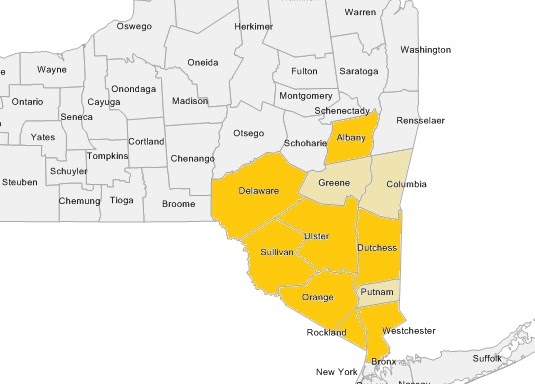
Data & maps

Data that makes pilots real

Use these snapshots, maps, and briefs to choose sites and write grants. We favor decision-grade truth over perfect data.

Start here

Pick the next action. Then go deeper.

Open maps hub

Planning layers for siting and logistics.

Open the Atlas

Interactive layer exploration.

Browse biosolids snapshots

County briefs + figures in one place.

Planning work needed

Regional context map with assessment overlays

Planning work needed to unlock these datasets → Recommendations & next steps

Hudson Valley regional context map overlaid with assessment areas
Regional context map courtesy of the previous assessment – pair these overlays with the biosolids snapshots below to see how counties stack up.

How to use it

  • Use biosolids snapshots to compare routes before partners commit.
  • Use EJ references early to avoid harm and plan benefits.
  • Bring this map to siting meetings to align on boundaries fast.
  • Drop these facts into grant drafts to show why the pilot fits.

Planning work needed to unlock these datasets keeps every pilot grounded in documented regional context and equity guardrails.

Decision-grade (not perfect)

We prefer data that improves choices quickly over data that’s “complete” but unusable.

  • Directional volumes & flows
  • Constraints & bottlenecks
  • Credible sources & citations

Local reality

County-by-county views matter because infrastructure is local: routing, siting, and politics.

  • County snapshots
  • Regional flow logic
  • Site archetypes

Legitimacy and EJ

EJ is a design constraint. Data supports better questions, earlier, with the community.

  • Burden/benefit framing
  • Permitting awareness
  • Stakeholder trust

What this page is

  • A launchpad for planning artifacts.
  • Directional snapshots that speed up decisions.
  • Links to sources you can cite.

What this page is not

  • A live database of current operations.
  • A substitute for operator verification.
  • A final engineering design.
Map of excess food waste generators across the Hudson Valley

Maps & Atlas

Visual planning layers across the Hudson Valley paired with the Atlas map so you can orient pilots, partners, and funders.

Map links

County biosolids flow snapshots

Quick reference images from reports/county-biosolid-flows. Use these as directional context. Confirm details with operators before you lock a plan.

County briefs (interpretation)

Tap the "Read brief" button to open the accompanying interpretation before reviewing the snapshots, then use "View image" to open the gallery-sized figure without leaving the page.

Landfilled biosolids, 2015
Flagship landfilled biosolids snapshot, 2015.

Landfilled (All)

Biosolids, 2015

Read brief

Flagship narrative now frames cost, emissions, control, and legitimacy as a concise problem statement - pick Why this matters or What pilots can do to see how it informs pilots.

Westchester County biosolids, 2015

Westchester

Biosolids, 2015

Read brief
Water chestnut mat slump on the water surface
Water chestnut harvests mirror the invasive species intent (NYSDEC image).
Invasive species feedstocks

Turn removal into reuse

The Feedstocks report introduces anaerobic digestion as a pathway for handling invasive aquatic and wetland plants. The new brief shows how harvested biomass can be staged, permitted, and blended for digestion.

  • Spotlights water chestnut, hydrilla, and phragmites as digestible biomass once removed from regulated waters.
  • Highlights permitting triggers and data gaps so pilots can plan logistics without spreading fragments.
  • Lists HVB next steps that connect harvest volumes, contamination risk, and digestate reuse to real pilots.

Composting infrastructure (CWMI)

The Cornell Waste Management Institute map catalogs compost, digestion, and permitted organics sites across New York State; use it as a strategic baseline while packaging circular feedstock plans.

CWMI New York State compost facilities map
CWMI New York compost facilities map.

Why this map matters

Cornell Waste Management Institute keeps the inventory fresh with permit notes, service-area context, and prioritized updates so you can trust its baseline signal.

  • Identifies compost, anaerobic digestion, and permitted organics processors statewide with operator, permit, and contact metadata.
  • Interactive filters spotlight compost type, shipment direction, and permit status so you can focus on the asset class your pilot needs.
  • Submit updates to capture new projects, capacity shifts, or service-area clarifications that affect haul planning.

Environmental justice references

Reference PDFs in reports/environmental-justics-map. These inform early siting and stakeholder conversations.

What we use EJ references for

  • Spot communities that already carry heavy burdens.
  • Plan benefits and mitigations early.
  • Anticipate permits and public meetings.
  • Decide if a site is a non-starter.

Quick links (PDF)

Full list lives in the folder; this page highlights common starting points.

If a pilot touches an EJ community, write the benefits, the engagement plan, and the red lines. No surprises.

FAQ

Skeptical questions are healthy. Here are ours.

Is this the “latest” data?

Some snapshots are historical (e.g., 2015 images). HVB treats them as directional and pairs them with current stakeholder input during pilot packaging.

Can these images be reused in presentations?

Yes—these are here to be used in workshops and grant packaging. When possible, cite HVB and the source report.

Where are the raw spreadsheets?

As the initiative matures, we can publish structured datasets. For now, HVB prioritizes decision-grade artifacts that accelerate pilots.

Use the data to move a pilot

The goal isn’t to admire the map. It’s to design a project that’s feasible, fundable, and legitimate.